Minimize Motion and Transport Muda in the Lab
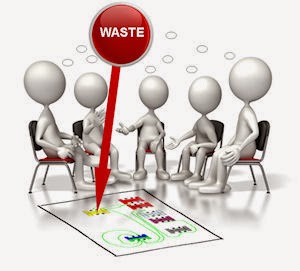
Continuous operational flow with streamlined processes is the ideal for any analytical lab. This can be achieved by organising the workspace to reduce time wasted by motion and transport. Creating a motion map or a spaghetti diagram can help understand process flow and identify areas of "traffic", unnecessary journeys, obstacles and bottlenecks - see the map I generated for a PCR process below. Draw a basic floor plan of the facility and map every motion involved in a process - record the amount of time spent in motion and gauge distances. Review the map and data and see how process motion can be improved. Can the workspace be reorganised to minimize the amount of travel? Can instruments be relocated? Can consumables or reagents be stored in more accessible area? Many facilities have shared equipment rooms - can the number of visitations be reduced. Consider batch size also, is it better to process smaller amounts or take several journeys to transport a larger batch? Review transportation methods - if there's a trolley available use it! Motion and transport are huge wastes in laboratories and they also contribute to waiting. Not only is time wasted physically, but sample deterioration can also occur, not to mention opportunities for bioburden to accumulate. So when streamlining an analytical process consider levelling sample loads, ensure that the queuing system is optimized for sample storage and enhance logistics by making equipments an instruments readily accessible to minimize journeys and delays.
Spagetthi Diagram - Motion Map
 |
| Spaghetti diagram for my qPCR assay.....clearly we need to rearrange a few things! |
Time, money and energy is lost in motion!
An optimized process flow with reduced transport and movements can help minimize errors and reduces fatigue for the lab staff. Continuous flow, creates a more streamlined workload and increases productivity. Mapping a process is an essential step of value stream mapping and is very useful in identifying waste, delays and bottlenecks:
- Unnecessary motion of people during process sampling
- Unnecessary transport of personnel, product, sample, reagents, information
- Inconvenient location of equipment, instruments and materials
Many companies will have a value stream map (VSM) for a product. However it is worth creating a specific VSM for the QC analysis process of that product to help improve laboratory efficiencies. Time is also lost in the transfer of information and data. Processes should be optimized to ensure there is an efficient system in place for sample collection, data processing and delivering data results. An efficient LIMS system will dramatically improve data transfer and reduce waiting. The Kanban tool can be used in conjunction to help visualise the process, particularly where quesues and volatile workloads are involved (refer to Kanban post).
An example of bioMérieux Work flow Optimization
 |
Spaghetti diagram of current workflow and new implemented workflow
Value Stream Map
Creating a current state value stream map is an efficient tool to understand the logistical flow of a process, provide detail on the value of each step and detect non value added elelments with opportunities for Kaizen events - continuous improvement. A VSM illustrates the flow of information, data, processes, inputs outputs and integrates metrics to evaluate value in terms of time and cost. A current state VSM with Kaizen events can be used to project future efficiencies by generating a projected, future state VSM. The illustration below outlines the flow of infomation, materials and lead time. Each individual step in the process includes metrics relating to cycle time and delays.
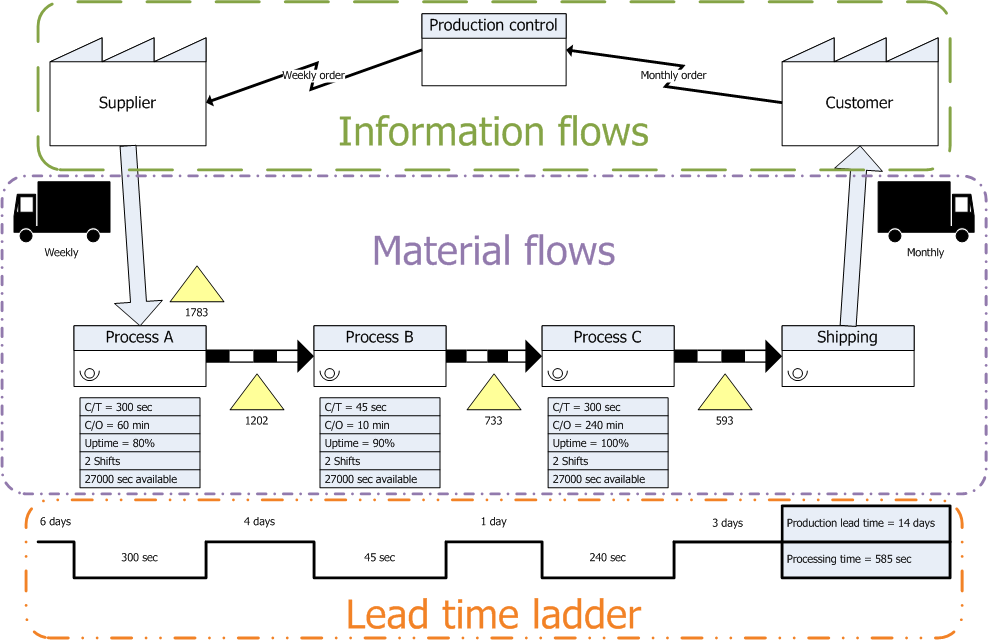
Current state VSM can provide details relating to:
 |
| First in First Out Processing |
- Queues (backlog) of work items. Queues are organised based on the number of items waiting to be processed.
- Queues can be prioritized in several ways, i.e. First-In-First-Out (FIFO)
- Wait time - how long a sample is in a queue
- Work time how long it takes to process/analyse a sample
- Identifying bottlenecks and causes of delay
- Identify areas of unproductive work, resource imbalances
- Areas of automation or manual processing
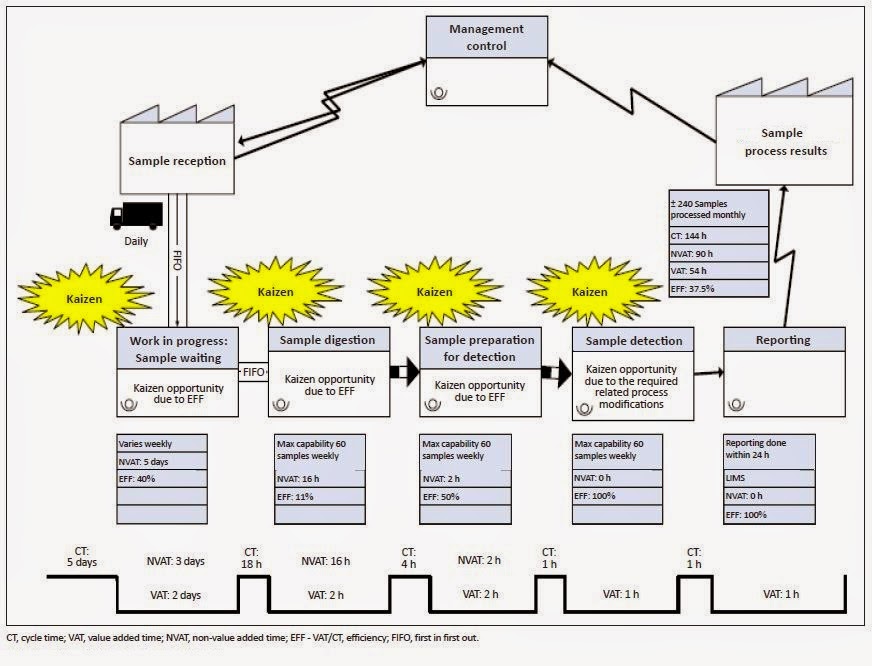 |
| Current VSM depicting the process flow of a sample from delivery, processing to release of results, with intermittent Kaizen events. |
No comments:
Post a Comment